Zero Capex Solar for South African Business: Pay-for-Performance PPAs that Deliver Cost Savings with No Upfront Investment
Purchase cheaper solar energy per kWh with no upfront investment.
By Next Renewable Generation
Executive summary
Zero capex solar means you host a solar PV (photovoltaic) generating asset but do not pay for the asset. Unlike a take-or-pay PPA (Power Purchase Agreement), in a pay-for-performance PPA, you pay only for verified kWh delivered at an agreed R/kWh tariff, so savings can be realised immediately from commissioning. The model is typically best suited to sites with a strong daytime consumption profile. Performance and maintenance obligations in the PPA remain with the IPP (Independent Power Producer).
Definitions and compliance in South Africa
Next Renewable Generation describes a commercial solar PPA as an IPP funded, owned, and operated facility on your premises that sells you energy at an agreed R/kWh tariff for a set term, often 10 to 20 years.
On the regulatory side, the licensing exemption and registration framework is defined in the amended Schedule 2 of the South African Electricity Regulation Act (Act 4 of 2006) as gazetted by the Department of Mineral Resources and Energy, and it is commonly implemented through distributor connection rules and registration processes. Requirements vary by distributor and municipality, so your compliance pathway must be confirmed for your specific point of supply.
A key practical point comes from NERSA(National Energy Regulator of South Africa): if your embedded generation facility has a point of connection to the electricity grid, registration obligations are based on the facility’s installed capacity and not on whether energy is exported or consumed on site. NERSA states that systems of 100 kW or less register with the relevant distributor (Eskom or the municipality), and systems above 100 kW register directly with NERSA, while facilities with no point of connection to the grid are exempt from registration requirements.
How the pay-for-performance PPA works
You are the facility host and the energy offtaker. The IPP funds and owns the facility, appoints the EPC (Engineering, Procurement and Construction) contractor for construction, and remains responsible for monitoring and operations and maintenance for the term of the PPA. Payments should be based on verified kWh delivered, not a fixed monthly repayments, to keep the arrangement performance based.
A well structured PPA should include accurate energy metering, often a main and check meter, clear performance standards, and defined remedies if standards are not met.
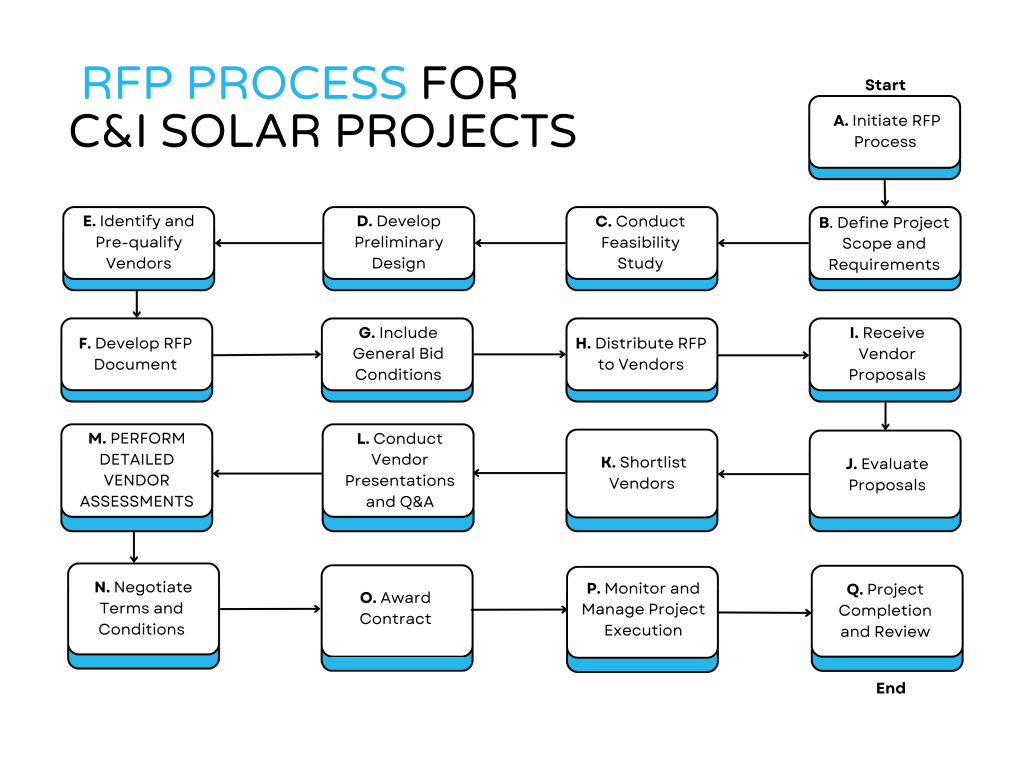
Project steps:
(Scoll)
|
1
LOAD AND
TARIFF ANALYSIS |
2
SITE SURVEY
AND GRID PRE-CHECK |
3
PPA PROPOSAL:
TARIFF AND GUARANTEES |
4
APPROVALS
AND REGISTRATION |
5
BUILD AND
COMMISSIONING |
6
MONITORING AND
OPERATIONS AND MANAGEMENT |
Financial value in South Africa with stated assumptions
All currency below is in ZAR (R), VAT excluded, unless stated.
A NERSA-approved municipal tariff schedule shows tariffs for small commercial energy charges could be within range R3.92 to R4.12 per kWh. Against a grid tariff basis like this, PPA tariffs for embedded solar can be compelling because the PPA tariff is able to undercut and beat the customer’s daytime cost of grid energy.
For indicative PPA deal economics, GreenCape benchmarking notes that an embedded PPA can be priced as much as 30% cheaper per kWh than existing Eskom or municipal tariffs (your actual savings realised depends on your tariff structure, time-of-use exposure, and load profile).
Assumptions used above (illustrative): avoided energy charge R3.50/kWh, PPA tariff R1.20/kWh, PV yield 1,600 to 1,800 kWh/kWp/year (site dependent). Under these assumptions, each self-consumed solar kWh saves about R2.30.
Tax note: (ownership-dependent): The South African Revenue Service’s Section 12B regulation allows for a 100% first-year deduction for qualifying PV generation assets not exceeding 1 MW brought into use for the first time. Under a PPA, the IPP usually owns the asset, so the benefit of such tax deductions are typically priced into an improved PPA tariff rather than claimed by the offtaker.
Operational impact, suitability, and common risks
A PPA keeps solar off your maintenance workbook. The IPP maintains the facility and bears performance risk, and longer-term PPA models allocate routine Operations and Maintenance responsibilities to the seller for the term of the PPA.
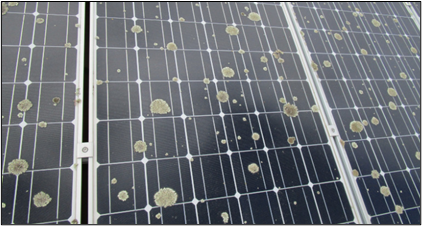
South Africa-specific Operations and Maintenance best-practice guidelines and practices supported by SAPVIA emphasise monitoring, documentation, and consistent Operations and Maintenance execution as central to delivering expected facility performance over time.
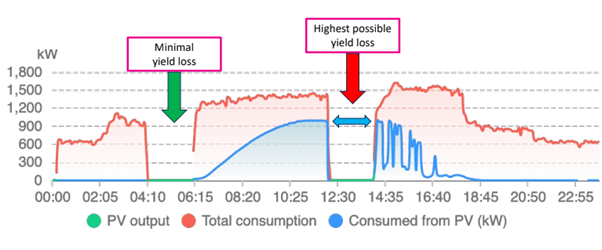
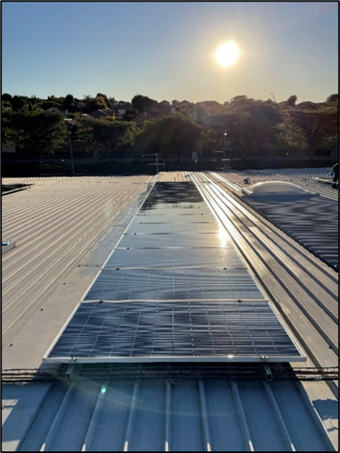
Best-fit sites usually have good alignment of daytime site load and solar generation profiles, with suitable roof or carport space (condition and shading), and a clear grid-connection pathway aligned to local distributor rules.
Common objections and mitigations:
- Longer duration PPA terms – mitigate with assignment provisions and clear end-of-term options (extend, buy, or remove). Longer PPA terms, mitigate this by including clear transfer terms if business circumstances change, and by defining end-of-term options such as extend, buy, or remove.
- Tariff restructuring – mitigate with conservative modelling and self-consumption-first system sizing.
- Load-shedding expectations – mitigate by specifying storage and an appropriate backup architecture if continuity is required (this changes design, approvals, and pricing).
Financing options comparison:
|
Option |
Upfront investment | How you pay | Who owns |
Performance risk |
| PPA | low or none | per metered kWh | IPP | mostly IPP |
| Lease | low to moderate | fixed monthly | often transfers | shared |
| Loan | moderate | loan + Operations and Maintenance | you | you |
| Purchase | high | minimal ongoing | you | you |
*The above may vary depending on the specific contract terms.
Do offtakers pay when the system is down?
A pay-for-performance PPA should bill off-takers only on metered kWh, with performance remedies defined up front.
What approvals do we need?
Distributor connection approval and registration aligned to NERSA facility capacity thresholds, plus technical compliance for grid connection.
Will solar work during load shedding?
Not unless designed and scope at the outset for backup, specify storage and changeover if you need continuity of supply.
What happens at the end of PPA term?
Extend, buy, or remove, define this in the PPA terms before signing.
Can we claim tax incentives?
Usually the asset owner claims capital allowances, confirming handling with your tax advisor.